Here’s the thing: while Washington and Tehran were busy shaking hands (or at least hinting at it), sending tremors of optimism through traditional markets, Bitcoin decided to go rogue. Forget the soaring stock indices hitting all-time highs or the comforting descent of oil prices; BTC is charting its own, rather bleak, course, actively shunning any good news that might buoy risk assets. It’s a divergence so stark it begs the question: is the king of crypto losing its marbles, or is this a signal of something deeper at play?
Look, the narrative was supposed to be straightforward. A US-Iran peace deal emerging from the murky geopolitical waters? Naturally, you’d expect everything with a whiff of risk to party together. Stocks, the usual bellwethers for such optimism, blasted off to fresh record territory. WTI crude, that barometer of global demand and supply disruptions, plummeted like a stone – down to its lowest since late April, shedding the war premium it had been sporting. The Strait of Hormuz, a vital artery for global oil, whispered promises of reopening. A 60-day negotiation period, potentially capped by a UN Security Council resolution, if it all holds. Seems like a clear win for anything that thrives on stability.
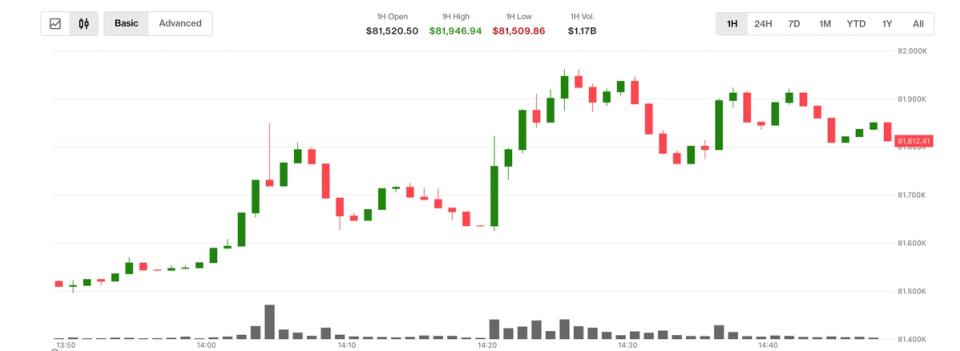
But Bitcoin? Bitcoin yawned and kept falling. Data showed BTC/USD slipping, chasing week-to-date lows. It’s not just a temporary hiccup; it’s a continuation of a trend. For weeks now, crypto has been dancing to a different tune than the broader equity market, and this particular dance is decidedly grim. While traders usually look for a rising tide to lift all boats, it seems Bitcoin is happy to sink while the rest of the fleet sails on.
Why is Bitcoin Diverging from Stocks?
This isn’t your typical correlation breakdown. Usually, when stocks are up, risk-on sentiment pulls crypto along for the ride. But here, we’re seeing a direct inverse. The oil price, often seen as a proxy for economic health and geopolitical stability, is mirroring Bitcoin’s downward trajectory more closely than equities. It’s as if the market is pricing in the peace deal’s impact on energy flows and then, in a separate, almost spiteful move, deciding that digital gold isn’t interested in the party.
Traders, ever the pragmatists, are staring at order books and seeing potential liquidity grabs. One analyst pointed out that while there’s plenty of liquidity above, it’s spread thin, offering no clear upside target. Below, however, a significant cluster of liquidations around the $74,000 mark could act as a magnet. The sentiment? Continuation to the downside is the more likely scenario. It’s a grim outlook, painting a picture of a market that’s not just weak, but actively looking for reasons to crater further.
“An upside sweep can’t be ruled out, but imo continuation to the downside is still more likely.”
This divergence raises a fascinating architectural question for crypto. Is Bitcoin truly becoming a flight-to-safety asset, as its proponents often claim, or is it still primarily a speculative bet that’s overly sensitive to specific market narratives that don’t align with broader macroeconomic easing? The current price action suggests the latter, at least for now.
Is Bitcoin Stuck in a Bearish Rut?
Other voices in the market echo the bearish sentiment. Describing BTC’s price action as “weak and bearish,” one commentator sees a potential drop to $72,000. Adding to the technical gloom, there’s talk of a potential “death cross”—the 21-day and 50-day simple moving averages converging in a bearish signal—looming for Bitcoin. This isn’t just noise; it’s the kind of technical analysis that often precedes significant price moves, and not in a good way for bulls.
Even those who usually champion a bullish outlook are finding it hard to maintain optimism. One analyst noted that while Bitcoin is retesting the top of an ascending triangle on daily charts, and theoretically remains bullish as long as it holds support levels, the broader market sentiment is simply not cooperating. It’s a classic case of fundamentals (or at least perceived macro tailwinds) being overridden by short-term technical pressures and a distinct lack of buying conviction.
The historical parallel here is instructive, if slightly unsettling. During periods of significant geopolitical de-escalation, the traditional ‘risk-on’ assets like stocks tend to rally. Bitcoin, however, has shown an increasing tendency to move with, or even against, these trends based on its own internal market dynamics and speculative fervor, rather than reflecting a broader embrace of risk. This isn’t the uncorrelated asset many hoped for; it’s a more complex beast, influenced by its own nascent but powerful ecosystem.
The immediate takeaway is that the peace deal, while a boon for global stability and a catalyst for traditional markets, is proving to be a damp squib for Bitcoin. The narrative has shifted from geopolitical tension to macro economic easing, and Bitcoin seems to be on the wrong side of that particular trade, looking for downside rather than upside.
🧬 Related Insights
- Read more: [Staff Statement] Crypto UI Broker-Dealer Registration Alert
- Read more: Bitcoin Blasts Past $69K on Fading Iran War Fears—But Don’t Get Too Cozy
Frequently Asked Questions
What does the US-Iran peace deal mean for Bitcoin?
Currently, it means very little in a positive sense. While the deal boosts stocks and lowers oil prices, Bitcoin has failed to benefit and is instead showing bearish price action.
Will Bitcoin price recover soon?
Technical indicators and market sentiment suggest a potential continued downtrend. While a recovery isn’t impossible, immediate prospects appear bearish based on current analysis.
Why does Bitcoin move differently from stocks now?
Bitcoin’s price action is increasingly influenced by its own market dynamics, speculative trading, and specific crypto narratives, leading to divergences from traditional assets like stocks, especially during periods of broad macro shifts.