For the everyday investor holding Bitcoin, this isn’t just about charts and liquidation levels; it’s about when the price might finally stabilize or, more pressingly, continue its slide. Right now, the signals aren’t pointing toward an immediate surge. Instead, we’re seeing a market where potential buyers are sitting on their hands, waiting for a deeper discount. The data indicates a preference for accumulating Bitcoin at lower price points, a stark contrast to the FOMO-driven rallies of the past.
The Absent Dip Buyer
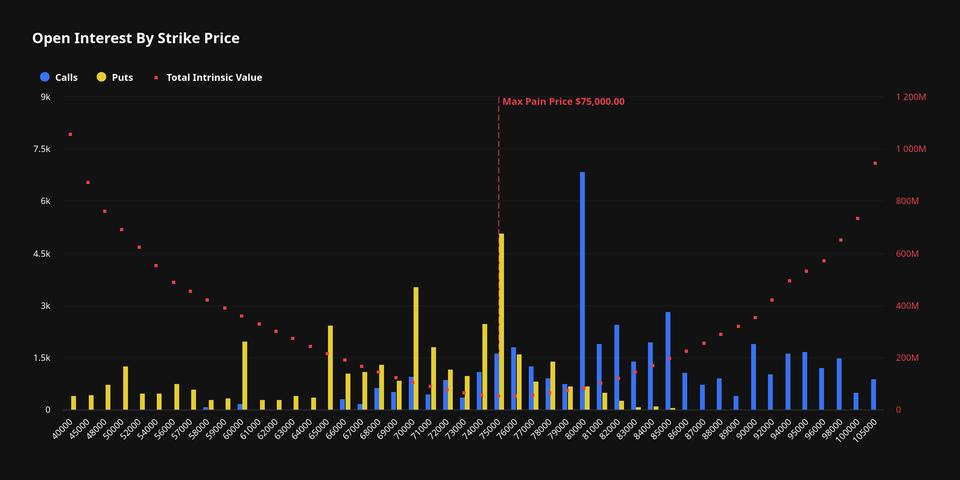
Forget chasing new highs above $80,000 for a moment. The market dynamics are currently telling a different story: traders are prioritizing deeper liquidity pools. This means they’re looking for more substantial price drops before committing new capital. The cumulative long positions exposed near $74,700, amounting to over $3.4 billion, are a significant pressure point. And if Bitcoin dips to $70,000, that figure balloons to an eye-watering $11 billion across a 90-day liquidation range. That’s a lot of capital vulnerable to a cascading sell-off.
Retail Sentiment: A Double-Edged Sword
Here’s where it gets interesting. Crypto analytics platform Hyblock highlights that retail traders are leaning heavily bullish again. Their “True Retail Accounts” long percentage metric has climbed above 60%. This sounds positive, right? Wrong. History suggests this is a red flag. Previous spikes into the “extreme long” zone for retail investors have historically coincided with short-term local tops. We saw this play out in early May when rallies toward the $78,000-$82,000 range cooled off after retail positioning became too crowded, leading to price momentum decay.
Even more telling, Hyblock’s analysis shows that the strongest recovery points for Bitcoin often emerge when retail traders turn aggressively bearish. Periods where fewer than 35% of retail accounts held long positions preceded significant rebounds from the mid-$60,000 range in March and April. This suggests that capitulation from retail, not greed, has been the precursor to substantial upward moves.
The RSI and the Waiting Game
When you combine Hyblock’s retail positioning metric with a 14-period relative strength index (RSI), the current picture becomes clearer. The TRA Long (%) is sitting near 60.7%, while the RSI remains elevated at 74.9. This combination strongly suggests that retail traders are still positioned for prices near $76,000. This isn’t necessarily a prediction of immediate doom, but it certainly points to a higher probability of a deeper correction if Bitcoin follows its previous market behavior. It’s a classic case of sentiment extremes preceding price reversals.
The strongest recovery points appeared when retail traders turned aggressively bearish.
This observation from Hyblock is critical. It implies that the “bottoms” are often found not when everyone is buying, but when everyone is panicking and selling. The current setup, with retail sentiment still firmly in bullish territory, doesn’t align with historical patterns that precede sustainable rallies.
What’s the Real Story Here?
The corporate PR machines will, of course, spin this as a sign of resilience or a healthy consolidation. But the data tells a different, more pragmatic story: the market is currently exhibiting traits that have historically preceded downward price movements. The absence of eager dip buyers, the sheer volume of liquidatable long positions, and the still-optimistic retail sentiment all combine to paint a picture of caution. It’s not about if Bitcoin will go lower, but how much and when the true capitulation will occur that marks the next true buying opportunity.
Why Does This Matter for Investors?
For anyone with skin in the crypto game, this analysis isn’t just academic. It’s a heads-up. The current price action suggests that the narrative of a straight-line upward trajectory might be premature. Investors who have been waiting for a better entry point might be rewarded for their patience. Conversely, those who are over-use or chasing the current momentum without considering liquidation risks are in a precarious position. The $70,000 mark, once a psychological barrier, now appears to be a more realistic target for discerning dip buyers, provided the liquidation cascade doesn’t force prices even lower.
Bitcoin’s current price chart, when viewed through the lens of these liquidity and sentiment indicators, is less about immediate upside potential and more about managing downside risk. The market is signaling patience, and for those who understand the data, patience could be the most profitable strategy right now.
🧬 Related Insights
- Read more: Lagarde’s Stablecoin Skepticism Fuels Dollar Dominance
- Read more: Galaxy Digital’s Crypto Core Prints $505M Profit—But That $241M Net Loss? Stock Doesn’t Care, Up 11%
Frequently Asked Questions
What is Bitcoin’s “True Retail Accounts” metric? This metric, as defined by Hyblock, tracks the percentage of retail futures accounts that are currently holding long positions on Bitcoin. A high percentage suggests widespread bullish sentiment among retail traders.
Will Bitcoin definitely go to $70,000? While data indicates that $70,000 is a key liquidation level and a potential target for dip buyers, no one can definitively predict exact price movements in the volatile cryptocurrency market. This analysis highlights a potential scenario based on current market dynamics and historical data.
Are retail traders always wrong about Bitcoin? Not always, but their sentiment extremes (either extreme bullishness or extreme bearishness) have historically been strong indicators of short-term market tops and bottoms, respectively. Their heaviest buying often occurs near peaks, and their heaviest selling near troughs.