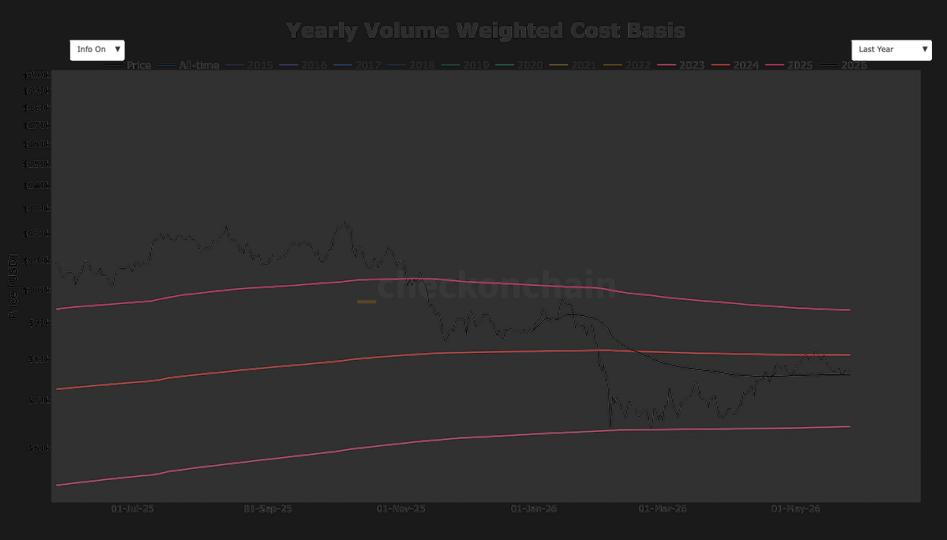
Bitcoin is “completely mispriced” to the downside. That’s the hot take from some analysts looking at the correlation between BTC and global M2 money supply. They’re throwing charts around, showing Bitcoin’s current price action in relation to M2 as historically anomalous. A Z-score near -2, they claim, represents “maximum mispricing.” This M2 bull case suggests an aggressive repricing is imminent. It’s the kind of optimistic pronouncement that usually gets the crypto crowd buzzing.
But hold on. Let’s pump the brakes on this liquidity-driven rocket ship.
Is Bitcoin Really ‘Mispriced’ by M2?
The argument hinges on a supposed strong positive correlation between Bitcoin and global M2 money supply. Historically, BTC has performed best when money supply grows. Now, the BTC/XAU ratio, apparently, is plummeting far below its expected trajectory. This, in theory, should lead to Bitcoin trying to catch up with global trends. It’s a neat theory. It makes for a good headline. It fits a narrative that many want to believe.
“If the BTC/liquidity relationship is still intact, then BTC is currently being completely mispriced,” RobynHD continued. “A Z-score near -2 has never occurred historically and points to the point of maximum mispricing.”
Look, correlation isn’t causation. It’s a lesson many in the finance world seem to forget every few years. This isn’t the first time someone has tried to shoehorn Bitcoin into a traditional economic model and declared it “mispriced” when it doesn’t perfectly fit. Remember when Bitcoin was supposed to be a perfect hedge against inflation? Or when its price was directly tied to interest rate hikes? Those narratives tend to fade when the data gets inconvenient.
The M2 Argument: A Flawed Design?
Predictably, not everyone’s buying it. The M2 correlation argument faces some serious skepticism. Julio Moreno, head of research at CryptoQuant, calls it “flawed from the design stage.” His points are sharp and valid. For starters, there’s no daily M2 data. Much of the data used is from China, where M2 is “basically always increasing.” That’s hardly a stable bedrock for such a definitive analysis. It’s like trying to predict the weather using only temperature readings from a single, perpetually hot day.
Then there are the timing inconsistencies. Critics point out that in 2022, M2 topped out after Bitcoin hit its bottom. If you’d been waiting for M2 to peak to make a move, you’d have sold the lows. Classic. Rekt Capital, a respected analyst, previously noted that Bitcoin’s bull market peak in November 2021 occurred months before global M2 even topped out in April 2022. Bitcoin, it seems, has a habit of doing its own thing.
This isn’t a new phenomenon. Throughout history, nascent asset classes, especially those with a decentralized ethos, have often defied conventional valuation models. Early stock markets, for instance, were wild, speculative affairs, driven by narratives and hype far more than today’s sophisticated quantitative analysis. Bitcoin, being a digital asset with a fixed supply and a global reach, operates on a different plane. To insist it must track M2 with clockwork precision is to misunderstand its fundamental nature. It’s akin to demanding a cheetah run at the same pace as a marathon runner. Different beasts, different speeds, different drivers.
The Cycle Story Still Holds Water
What these M2 proponents seem to conveniently ignore are the well-established Bitcoin cycles. The four-year halving cycle is not just a theoretical construct; it’s a pattern observed over multiple market cycles. While M2 might fluctuate, the predictable supply shocks inherent in Bitcoin’s design have a more direct and profound impact on its price, at least in the medium to long term. These cycles are driven by scarcity and adoption, not just the ebb and flow of global liquidity.
So, when Bitcoin collapses below a supposed M2 “fair value,