Here’s the thing: Bitcoin is staring down the barrel of another potential 10% haircut this month. It’s not some abstract fear-mongering; it’s a narrative woven into the very fabric of market history, a pattern that has played out time and again, and one that the data overwhelmingly supports. The old Wall Street adage, “Sell in May and go away,” once confined to the dusty corners of equity analysis, has a disconcerting habit of showing up in the crypto markets too.
Look at the S&P 500 itself. Since 1990, the index has averaged a modest -0.24% in May, followed by a stingy -2.25% over the subsequent three months. It’s a summer slump, a period where performance often stagnates before a late-year rally. But Bitcoin’s performance tells a far more dramatic story.
Bitcoin’s own May track record is brutal. In fact, it’s posted losses in May in 2013, 2015, 2018, 2021, 2022, and most recently, 2023. The average return one month later? A stark -10.1%. The three-month average doesn’t offer much solace either, clocking in at a negative -3.3%. This isn’t just a blip; it’s a statistically significant tendency for BTC to falter during the warmer months, acting as a short-term capitulation signal.
Is This Just Short-Term Noise or a Deeper Trend?
But here’s where things get interesting – and perhaps a little less grim for the true believers. Like its stock market cousins, Bitcoin’s longer-term outlook, when viewed through the lens of a “red May,” isn’t entirely bearish. The average return six months after a negative May? It skyrockets to a frankly astonishing +139%. Now, before you get too excited, remember that figure is heavily skewed by the monster rally of 2013. Strip that outlier out, and the six-month average comes back down to earth, albeit still a healthy +12.9%.
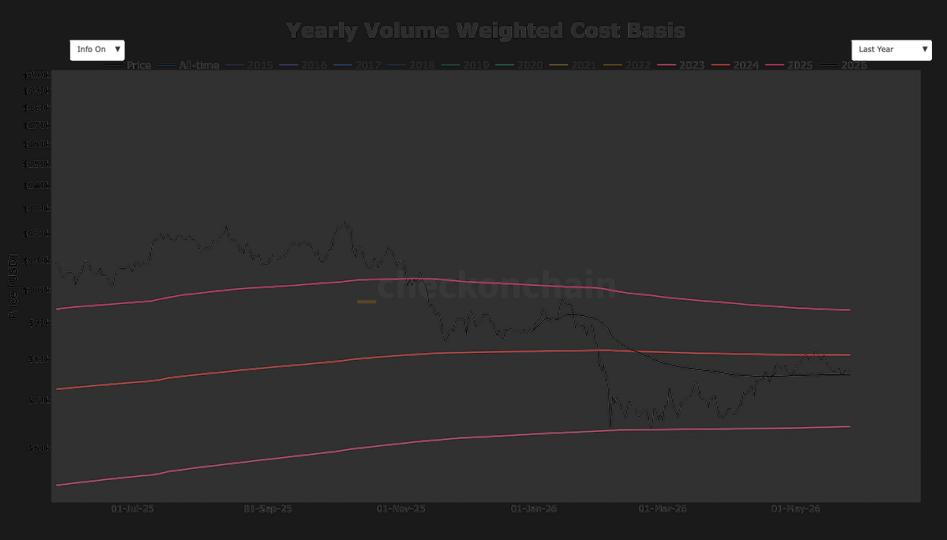
So, what does this mean for Bitcoin’s current price near $75,850? Based purely on these historical post-red-May averages, we could be looking at a dip towards $68,200 by June and a slight recovery to $73,350 by August. The six-month forecast, even adjusted for that 2013 anomaly, points towards a more realistic $85,600 by November. For long-term investors, the data suggests little reason to panic and exit the market – the summer weakness appears to be just that: short-term.
However, there’s a crucial caveat. If Bitcoin closes the month below $76,000, that red May candle will be nestled within a distinctly bear-market structure. We saw this play out in 2018 and 2022. These weren’t quick bottoms; they were part of broader bear cycles where BTC was already struggling, forming lower highs and lower lows.
In 2018 and 2022, May losses did not mark a quick bottom. Both years were already showing bear cycle signals, with BTC trading below major support and forming lower highs and lower lows.
Following those red May closes, Bitcoin plunged an average of 26% one month later, 21.6% three months later, and a staggering 46% six months later. This distinction is vital: in ‘normal’ years, a negative May signals temporary pain; in confirmed bear markets, it’s a precursor to deeper capitulation.
Where’s the Line Between Correction and Collapse?
Right now, 2024 isn’t a definitively confirmed bear market year – not yet. In previous downturns, BTC had already cratered below major cycle support levels – think $6,000 in 2018 and $30,000–$32,000 in 2022 – before the real pain set in. Currently, BTC hovers above its cycle support near $60,000. A breach of this level would certainly bolster the bear case.
Similarly, a monthly close below the $70,000–$72,000 range would embolden the bears. But a truly alarming break below $60,000–$65,000? That would make it exceedingly difficult to dismiss the current market movements as a mere correction rather than the dreaded beginning of another prolonged bear market. The historical precedent is clear: May’s volatility, while often a short-term hiccup, can also serve as an ominous prelude to deeper declines if underlying market structure is already compromised. The current price action, hovering above key support, suggests a cautious optimism for now, but the bears are watching that $60k level like hawks.