Skip to content
Fintech Dose
Explainers Digital Banking Payments & Wallets Crypto & Blockchain
Lending & Credit InsurTech RegTech & Compliance Startups & Funding AI in Finance

#spot-etfs

A chart showing Bitcoin price action with upward trends and indicators.
Crypto & Blockchain

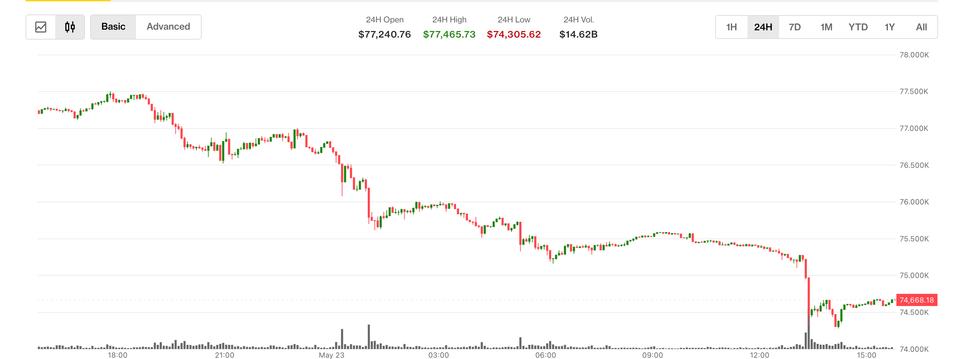
Bitcoin's $80K Quest: ETF Flows and Investor Puzzles

Is Bitcoin's journey to $80,000 an inevitable march or a speculative gamble? We dive into the data, from ETF flows to investor sentiment, to uncover the forces at play.

5 min read 2 days, 11 hours ago
Chart showing Bitcoin price decline and ETF outflow graph.
Crypto & Blockchain

Bitcoin Tumbles as ETFs Shed Billions

Bitcoin's sharp dive past $74,300 isn't just a blip. Billions are fleeing spot ETFs, and the reasons might surprise you.

5 min read 1 week, 3 days ago
Chart showing a steep decline in Bitcoin retail inflows on Binance.
Crypto & Blockchain

Bitcoin Retail Demand Plummets 73% Amid Futures Sell-off

The air is getting thin for retail Bitcoin investors. Demand has evaporated, plunging 73% as massive futures selling spooked the market. The question isn't if the bears are back, but how deep their teeth will sink.

6 min read 2 weeks ago
Jack Mallers speaking on a podcast stage.
Crypto & Blockchain

Mallers: Wall Street's Bitcoin Embrace is Inevitable

Strike CEO Jack Mallers is unfazed by Wall Street's growing Bitcoin presence, framing it as a natural evolution. He dismisses fears that institutional adoption corrupts Bitcoin's ethos.

5 min read 3 weeks, 3 days ago
Chart showing Bitcoin price rising above $81,000, with overlaid indicators suggesting caution in derivatives markets.
Crypto & Blockchain

Bitcoin Hits $81K: Is Rally Sustainable Amidst Flat Derivatives?

Bitcoin's latest surge past $81,000 is a remarkable feat, but a closer look at the derivatives market reveals a concerning disconnect. While spot ETFs see massive institutional buying, trading metrics suggest underlying investor reticence, raising questions about the rally's long-term viability.

4 min read 3 weeks, 6 days ago
Bitcoin price chart showing buyer-seller split amid wartime stability
Crypto & Blockchain

Bitcoin's Wartime Rift: Forced Buyers Catch the Panic Sell-Off

Sirens wail across conflict zones, trillions evaporate from stocks—Bitcoin barely blinks. That's the surface story. Underneath? A brutal split between robots buying on autopilot and humans bolting for the exits.

5 min read 1 month, 3 weeks ago

Categories

Explainers Digital Banking Payments & Wallets Crypto & Blockchain Lending & Credit InsurTech RegTech & Compliance Startups & Funding
Fintech Dose

Markets. Money. Innovation.

More

  • RSS Feed
  • Sitemap
  • About
  • Editorial Process
  • Advertise

Legal

  • Privacy
  • Terms
  • Work With Us

Our Network

The AI Catchup AI & Machine Learning Threat Digest Cybersecurity Legal AI Beat Legal Tech Fintech Rundown Finance & Banking DevTools Feed Developer Tools Open Source Beat Open Source Fintech Dose Crypto & DeFi Chip Beat Semiconductors AdTech Beat Ad Technology Supply Chain Beat Logistics

© 2026 Fintech Dose. All rights reserved.

🏠Home 🔍Search 🔖Saved 📂Categories
Privacy & cookies

We use a privacy-respecting analytics tool to count page views — no personal profiles, no ad tracking, no third-party cookies. Accept to help us understand which stories matter to readers.

Details