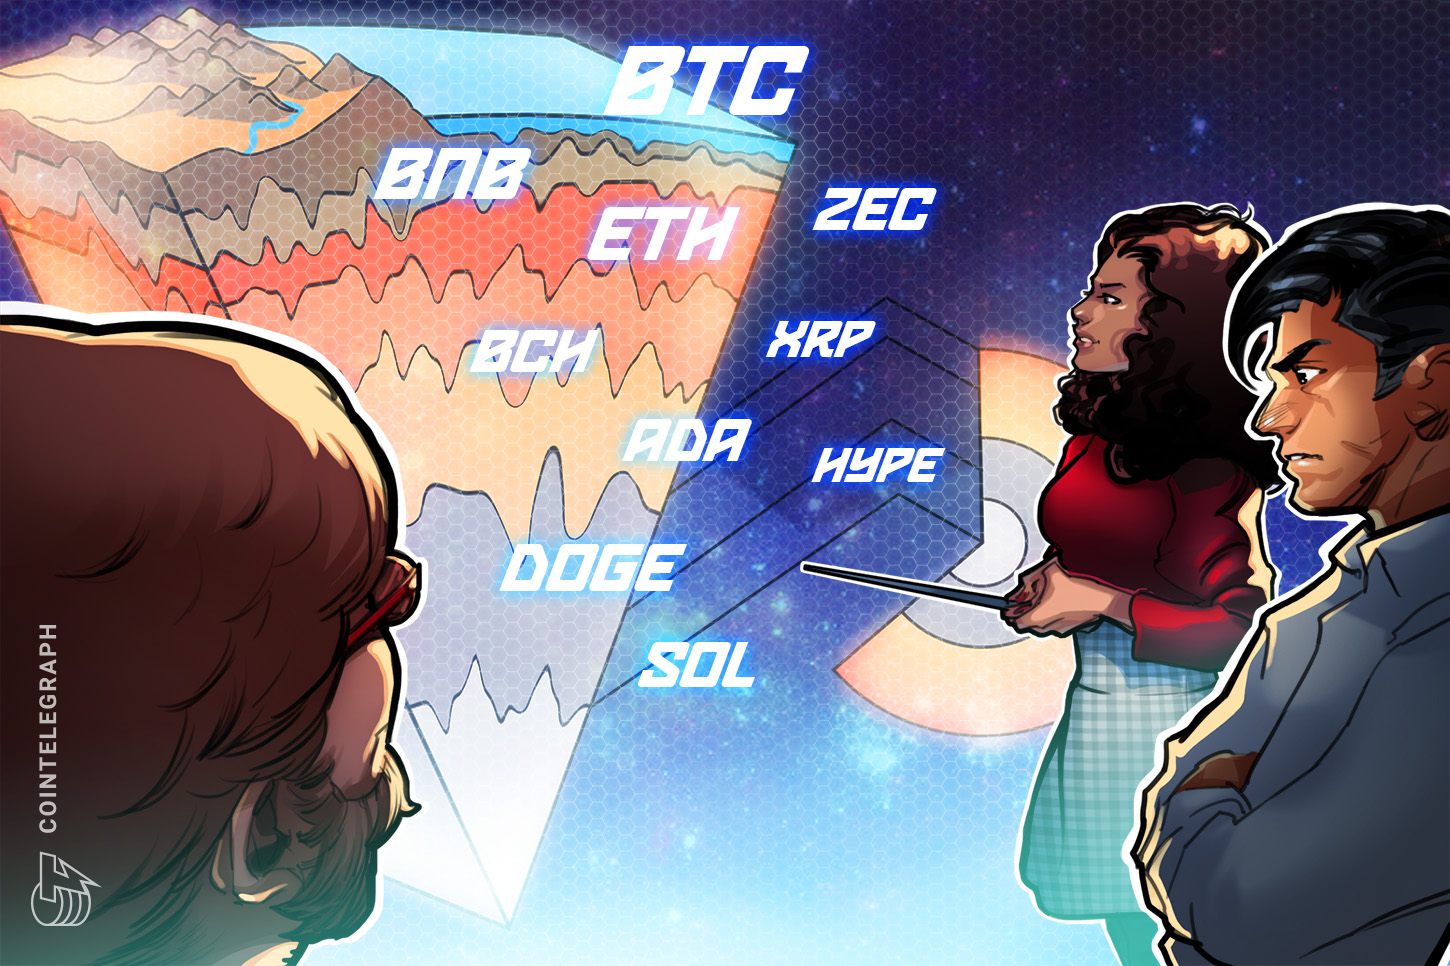
Crypto’s getting messy again.
Seriously, you look at these charts and it’s a sea of red, or at least, a hesitant pink. Bitcoin, bless its volatile heart, can’t seem to break that $84,000 ceiling, and it’s already retreated from its latest rally, slinking back below $79,000. The narrative from the usual crypto cheerleaders is starting to sound a bit thin, isn’t it? It’s the same old song and dance: buy the dip, hold on tight, the moon is near. But look closer, and you’ll see the real story—who’s actually cashing out and who’s left holding the digital bag.
Glassnode’s on-chain report is wagging a finger, pointing out that a lot of folks who bought in near the recent peaks around $86,900 might just be looking to offload their holdings to break even. That’s not exactly a recipe for a rocket ship, is it? And then there’s CryptoQuant, throwing cold water on the party by noting BTC is bumping its head against the 200-day moving average, a spot that’s historically acted like a brick wall. Back in 2022, failing to clear that level sent BTC into a nosedive. History repeating itself? Could be.
But wait, there’s a glimmer of hope, they say. Bulls haven’t let the price crater below $76,000. A minor win, I suppose. It suggests some conviction, or maybe just people not wanting to book losses yet. They’re waiting for another leg up, which, if you believe the charts, might be within reach… or might just be a mirage.
Is the 20-Day EMA the Last Stand for Bitcoin?
Bitcoin’s dancing around the 20-day exponential moving average, currently sitting around $79,251. This little line has been a decent support level recently. If it holds, bulls will probably have another crack at $84,000, and if they can smash through that, then maybe, just maybe, we’re looking at a run towards $92,000. But if it breaks below the 20-day EMA, don’t be surprised if it’s a quick trip down to the 50-day simple moving average, around $74,968, which, you guessed it, is also expected to attract some buyers. It’s all very circular, isn’t it? Someone’s always buying, someone’s always selling.
Ether’s Troubled Ascent
Ether (ETH) isn’t having a great time either. It’s dipped below the 50-day SMA ($2,250) after getting rejected by the 20-day EMA ($2,297). That’s not a picture of strength. The price is currently hugging the support line of an ascending channel. If that breaks, expect a drop to $1,916. The only silver lining? If it bounces off this support and gets back above the 20-day EMA, we might see it push towards $2,465. But “might” is the operative word here.
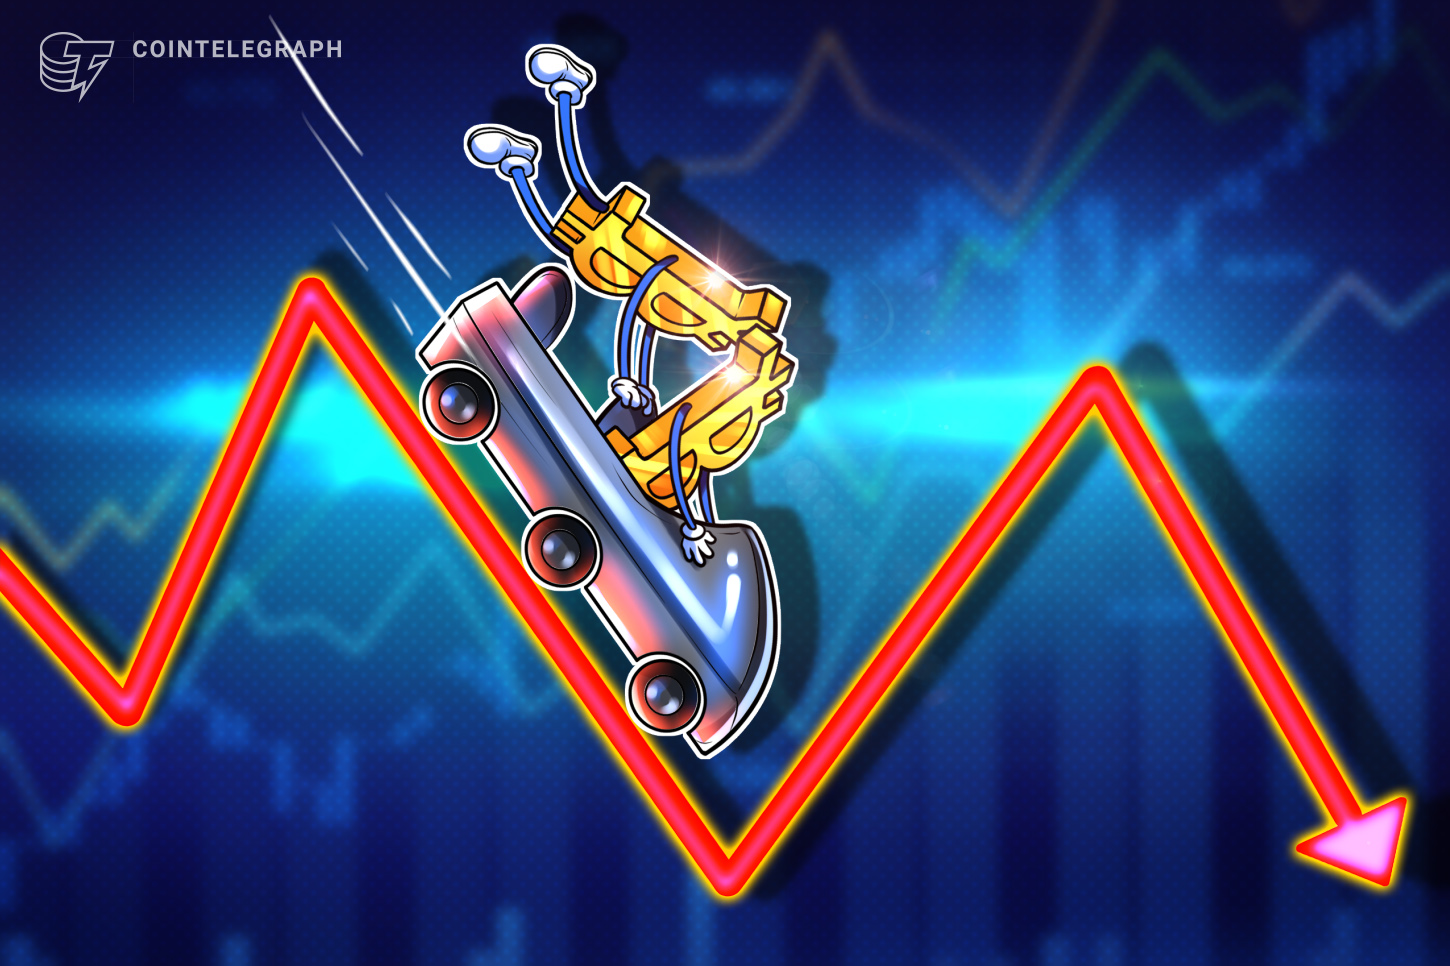
Sellers have pulled Bitcoin back below the $79,000 level, but buying may emerge as the price nears the $76,000 support.
BNB: Holding Steady, For Now
BNB seems to be doing a bit better, holding off sellers at the $687 mark. The 20-day EMA is trending upwards, and the RSI is flirting with overbought territory. This usually signals an upward trend. If BNB can clear $687, it’s theoretically looking at $730 and then $790. But remember, crypto’s a fickle beast. A sharp reversal from here could send it back into the $570-$687 range.
XRP’s Channel Quandary
XRP managed to poke its head above the downtrend line of its descending channel, only for sellers to yank it back down. Bulls failed to secure a close above that line, which is a bad sign. Sellers are looking to trap eager buyers. If they succeed, XRP could tumble to $1.27. Buyers, however, are hoping to push it back above that line, which would then pave the way for a test of the $1.61 resistance and potentially a new run towards $2.
Solana’s Wobble
Solana (SOL) had a similar story to Bitcoin – a bounce off the 20-day EMA, followed by a swift retreat. It’s now trading below that key EMA. If it stays there, expect it to chop around between $76 and $98 for a bit longer. Buyers need to get it back above the 20-day EMA, and fast.
So, who’s making money? Right now, it looks like the sellers. They’re dictating terms, forcing the bulls to defend increasingly lower levels. The market’s littered with potential support zones, but each one is a battleground, not a safe haven. It’s a classic case of price action where short-term traders might find opportunities, but the long-term investor is probably watching their portfolio shrink, or at best, tread water. This isn’t the euphoric surge many were hoping for. It’s a grind.