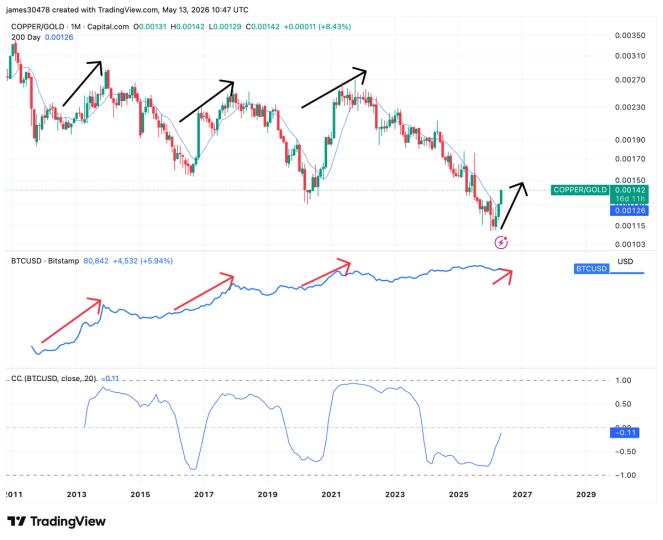
This isn’t just some obscure commodity chart. The copper-to-gold ratio, a barometer of global economic fervor and investor guts, is currently at 0.00142. That’s copper at $6.65 a pound versus gold clinging to $4,700 an ounce. And it just did something remarkable.
It has decisively climbed above its 200-day moving average. The first time this has happened, with any real conviction, since September 2020. Folks, that’s a timestamp. A timestamp that, historically, has been a harbinger of something big for Bitcoin.
The ratio itself has bounced 25% from its recent troughs. This isn’t just noise; it’s a clear signal. And it tends to lead Bitcoin by weeks, sometimes months. This reinforces the notion that the current crypto rally – if you can call this lukewarm affair a rally – might be in its infancy. We’re talking about a potential setup for something far more substantial than the current dribble we’re seeing.
Why the Copper-Gold Ratio Matters
Look, copper is industrial, it’s growth, it’s demand. Think factories humming, construction cranes swinging. Gold, well, gold’s the safe haven, the panic button. When the ratio climbs, it means investors are ditching the safety blanket for the riskier, more rewarding prospect of economic expansion. It’s a ‘risk-on’ indicator. And when the markets are feeling ‘risk-on,’ money tends to flow into assets like Bitcoin, which, despite its volatility, has increasingly become a speculative growth play.
The correlation coefficient between Bitcoin and this ratio is currently a tepid -0.11. Hardly a ringing endorsement of a strong partnership. But here’s the kicker: it’s rebounded sharply from a near-perfect negative correlation of -1.00. This is where it gets interesting. It suggests the relationship, while not yet positively synchronized, is starting to tighten its grip. As macro risk appetite improves, the two assets are beginning to dance to a more similar tune, rather than performing dueling solos.
Historically, during Bitcoin’s most spectacular bull runs, this correlation has nudged its way above 1.0. The current negative reading largely stems from that earlier divergence phase where the ratio was tanking and Bitcoin was often falling faster than copper. Now, as the ratio recovers, that relationship has begun to converge, aligning with a more favorable market environment.
Historically, the copper-to-gold ratio has led bitcoin by several weeks to months, suggesting the current move may still be in its early stages.
This isn’t some fleeting statistical anomaly. Previous surges in this ratio – specifically in 2013, 2017, and 2021 – were aligned with some of Bitcoin’s most explosive price action. This is a pattern. A pattern that, if it holds, suggests we’re not even close to the peak of this potential crypto ascent.
Is This a Guarantee for Bitcoin? Absolutely Not.
Correlation is not causation. And commodity prices are influenced by a dizzying array of factors, from geopolitical tensions and supply chain snags to central bank policies. The notion that a simple ratio of two metals dictates the fate of a digital asset is, frankly, absurd on its face. But as a signal? As one piece of a much larger puzzle? It’s compelling.
It’s also a stark reminder that Bitcoin, for all its talk of being digital gold or a decentralized revolution, remains deeply intertwined with the broader financial and economic landscape. When the world’s economic engine sputters, Bitcoin often feels the chill. Conversely, when confidence returns, when industrial metals start to shine, the speculative froth in digital assets tends to build.
The PR machine will, of course, spin this. They’ll talk about innovation, adoption, and the inevitable march of digital finance. But sometimes, the simplest, oldest signals – like the relative value of copper versus gold – offer a more grounded perspective. It’s a return to fundamentals, albeit in a very modern context.
So, while you shouldn’t bet the farm solely on this one indicator, keep an eye on the copper-to-gold ratio. It might just be whispering secrets about where Bitcoin is headed next. It’s a crude, but often effective, gauge of the world’s collective financial pulse.
What Does This Mean for Risk Appetite?
Essentially, this ratio’s ascent signals a collective sigh of relief, or perhaps a collective ‘let’s go!’ from the global investor class. It suggests that the fears of imminent economic collapse are subsiding, replaced by a tentative optimism. This optimism is fertile ground for riskier assets. Bitcoin, a digital asset that thrives on speculative capital, benefits immensely from such a shift. It’s the tide going out, exposing the hidden reefs of fear, only for the tide to come back in, lifting all boats – including the often-overleveraged ones in the crypto space.
The move is notable because it suggests that the market is increasingly factoring in a scenario of economic growth rather than recession. This shift is crucial for Bitcoin, which has, in recent cycles, acted as a barometer for broader market sentiment and risk tolerance. When investors are willing to take on more risk, capital naturally flows from safe havens like gold into growth-oriented and speculative assets like Bitcoin.
🧬 Related Insights
- Read more: Stablecoin Exposure: Are You Accidentally Gambling?
- Read more: Worldcoin Yanks 40% of WLD Token Flood—Just in Time for AI’s Human Check?
Frequently Asked Questions
What is the copper-to-gold ratio?
The copper-to-gold ratio is a financial metric comparing the price of copper to the price of gold. It’s often used as an indicator of economic strength and investor risk appetite, as copper tends to perform well during economic expansion while gold is seen as a safe-haven asset.
How does the copper-to-gold ratio affect Bitcoin’s price?
Historically, a rising copper-to-gold ratio has sometimes preceded periods of Bitcoin price appreciation. This is because the ratio signals improving economic sentiment and risk appetite, which can lead investors to allocate capital towards speculative assets like Bitcoin.
Is the copper-to-gold ratio a reliable predictor of Bitcoin’s future performance?
No single indicator can reliably predict Bitcoin’s future performance. While the copper-to-gold ratio has shown a historical correlation, it’s just one data point among many. Factors like regulatory news, technological developments, and broader market conditions also significantly influence Bitcoin’s price.